Kristin Hicks, Agronomic Services, NCDA&CS
In order to optimize growth, fruit quality and economic return, commercial strawberry production requires intensive and precise fertilization throughout the season. In high-value crops like strawberry, using a combined strategy of pre-season soil testing and in-season plant tissue analysis is an inexpensive and highly effective approach to optimize both strawberry yield and quality. Plant tissue testing measures nutrient levels in the leaflets and compares them to established target concentrations for healthy strawberries (Table 1). This analysis can reveal nutrient deficiencies and imbalances within the plant and allow growers to adjust fertility in response to changing crop needs. Plant tissue analysis in strawberry should include nitrogen (N), phosphorus (P), potassium (K), calcium (Ca), magnesium (Mg), and sulfur (S), iron (Fe), manganese (Mn), zinc (Zn), copper (Cu), and boron (B). In North Carolina, the most commonly encountered nutrient deficiencies in June-bearing strawberries are N, S, Mg and B.
Nitrogen and Nitrate-nitrogen. Of the 11 essential nutrients, nitrogen is needed in the highest amount, is the biggest driver of yield, and is most frequently found below sufficiency. In North Carolina, of the >4000 June-bearing strawberry tissue samples submitted to NCDA&CS for analysis from 2010-2021, 44% were below the critical concentration of 3.0 % N. Because of the importance of a steady supply of nitrogen in strawberry production, analysis of nitrate-nitrogen (NO3-N) in the petioles is also recommended. Petiole NO3-N levels represent a snapshot of N moving from the soil into the plant, are a better predictor of N needs than leaf tissue N, and should serve as the basis for weekly nitrogen rate determinations. The optimum amount of petiole NO3-N changes over the 12-week season; the target concentration is low at first bloom as the plants are emerging from winter dormancy but quickly reaches maximum demand in weeks two to four. As heavy fruiting begins, the target NO3-N begin to decrease in order to prevent harmful effects of excess N on fruit quality (Table 2).
Table 1. Plant tissue nutrient sufficiency ranges for strawberry*.
| Nutrient | Sufficiency Range |
| N (%) | 3.0–4.0 |
| P (%) | 0.2–0.4 |
| K (%) | 1.1–2.5 |
| Ca (%) | 0.5–1.5 |
| Mg (%) | 0.25–0.45 |
| S (%) | 0.15–0.4 |
| Fe (ppm) | 50–300 |
| Mn (ppm) | 30–300 |
| Zn (ppm) | 15–60 |
| Cu (ppm) | 3–15 |
| B (ppm) | 25–50 |
Table 2. Petiole nitrate nitrogen (NO3-N) target ranges for strawberry from week of 1st bloom.
| Week | Low | High |
| 1 | 250 | >500 |
| 2–3 | 2500 | 4000 |
| 4 | 2000 | 4000 |
| 5–8 | 1700 | 3200 |
| 9 | 900 | 2800 |
| 10 | 900 | 2500 |
| 11 | 600 | 1700 |
| 12+ | 450 | 900 |
Sulfur and Nitrogen: Sulfur ratio. In addition, elevated N can create an imbalance with S in plant metabolism. Monitoring the nitrogen to sulfur ratio (N:S) is an essential component of fertility management in strawberry. When N:S is greater than 18:1, it can lead to poor utilization of either or both N and S, even when tissue levels of these nutrients are sufficient. In North Carolina, 33% of strawberry samples had N:S ratios greater than 18:1 and 11% were below the critical concentration of 0.15 % S. Excessively high N:S or low S can be easily corrected with an injection of 1-2 lb S per acre. Common fertilizers used are Epsom salts (magnesium sulfate) (13% S) and potassium sulfate (18% S).
Magnesium. Over the same sample period, 7% of strawberry tissue samples were below the critical concentration of 0.25 % Mg. Deficient Mg causes yellowing between the veins of the older mature leaves and then progressing to the leaf edges. Epsom salts, MgSO4 (10% Mg), is often the fertilizer of choice because it also supplies S and moderates the N:S ratio. Injections of 7-10 lb Epsom salts per acre per week is generally sufficient to adequately supply both Mg and S throughout the production season.
Boron. Essential to good quality fruit, boron deficiency causes many symptoms, but among the most obvious are deformed berries, asymmetrical leaves, and stubby roots. In North Carolina, 8% of strawberry samples were below the critical concentration of 22 ppm B. If B was not applied pre-planting, a one-time application of 0.125 lb B per acre with the first or second fertigation is advisable. Any additional B application should be based solely on tissue analysis. Common B fertilizers include borax (11% B) and Solubor (20.5% B). In managing B fertility, of equal or greater importance than preventing B deficiency is avoiding B toxicity. In fact, B has been shown to be much more likely to cause crop loss through over-application than under-application. In strawberry, B toxicity presents as scorching of the leaf edges and is difficult to mitigate at this point.Growers should be very careful to apply only the recommended amount of B as the line between B sufficiency and B toxicity is very narrow.
How to collect a tissue sample. For routine in-season monitoring, plant tissue analysis should start when spring growth begins and continue every 1-2 weeks throughout blooming and fruiting stages. Plant tissue analysis is also useful If plants are showing signs of poor growth or health; these diagnostic samples can be collected at any growth stage and should include both samples of unhealthy and of healthy plants for comparison. Nutrient concentrations within the plant vary depending on the growth stage and on the plant part. Improperly collected tissue samples can produce unreliable results and lead to incorrect interpretations.
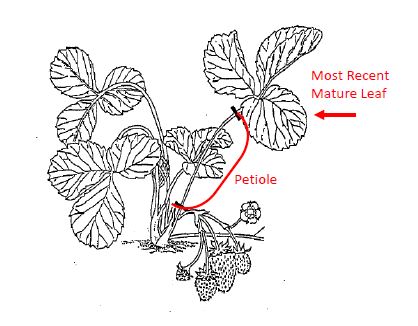
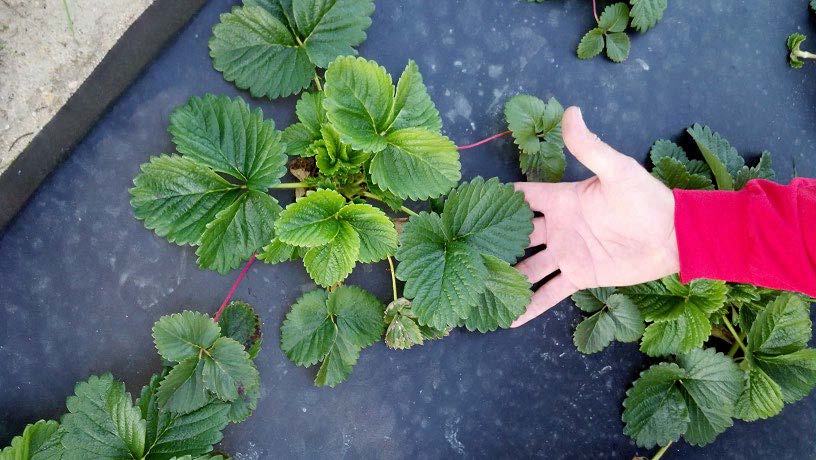
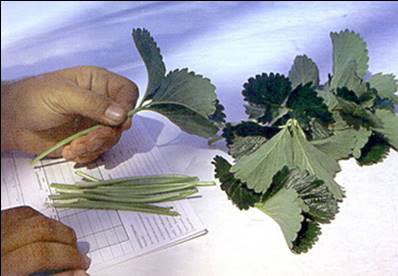
To collect a tissue sample from strawberry, select most recently mature, trifoliate leaves (MRMLs). These leaves are full-sized and green and consist of one petiole (leaf stalk) with three leaflets (Fig. 1). MRMLs are usually located three to five leaves back from the growing point and are neither newly emerging from the crown nor laying on the plastic (Fig. 2). When MRMLs are being collected, it is very important to detach the petiole from the leaflets immediately. This action halts nutrient transfer between the two plant parts and allows the two plant parts to be analyzed separately (Fig. 3).
Each sample should include leaves and petioles from 20 to 25 locations within a uniform area. For example, the plant material in a single sample should be the same variety, growing on the same soil type, at the same growth stage and having the same management history. When submitting tissue samples, be sure to include fertilization history and environmental conditions. In order to receive the correct interpretation, it is particularly important to accurately report the growth stage (Bloom or Fruit) and the number of weeks since first bloom.
View a pictorial guide to collecting and submitting strawberry tissue samples.
* Campbell CR, Miner GS. 2000. Strawberry, annual hill culture. In: Campbell CR, editor.
Reference sufficiency ranges for plant analysis in the southern region of the United States. Raleigh (NC): NC Dept of Agriculture & Consumer Services. Southern Cooperative Series Bulletin 394: www.ncagr.gov/agronomi/saaesd/scsb394.pdf