Z Rubio Ames1a, R. Corn1 and A. Deltsidis1
1Horticulture Department, University of Georgia, Tifton, USA
aCorresponding author: (Zilfina.rubioames@uga.edu) – Assistant Professor and Small Fruit Extension Specialist
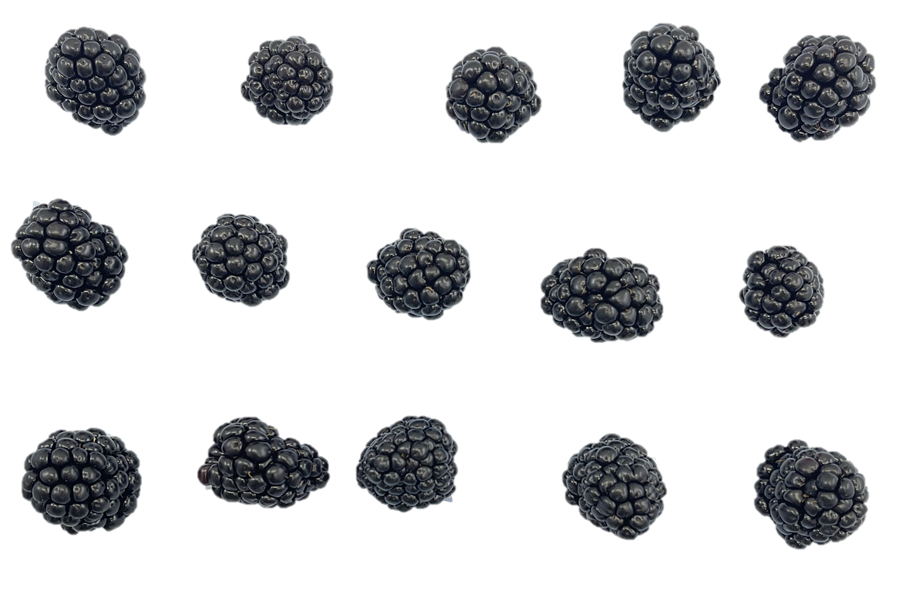
Blackberry production and consumption have increased in the United States over the past decade. Similarly, blackberry production acreage in Georgia has increased from 300 acres in 2009 to 1,858 acres in 2024 (NASS-USDA, 2024). Even though consumers prefer fruit with a good external appearance, repeat purchases depend on flavor. Three harvests and sensory evaluations were conducted during the 2023 blackberry season in Georgia. Blackberries of four cultivars, ‘Caddo’, ‘Ouachita’, ‘Ponca,’ and ‘Osage,’ were hand-picked, field-packed, and hand-sorted before being placed in cold storage (Fig. 1). Blackberries were stored for up to 21 days, and quality assessments were performed every 7 days. Quality assessments included visual quality, weight loss, color, firmness, red drupelet reversion (RDR) presence, titratable acidity (TA), and total soluble solids.
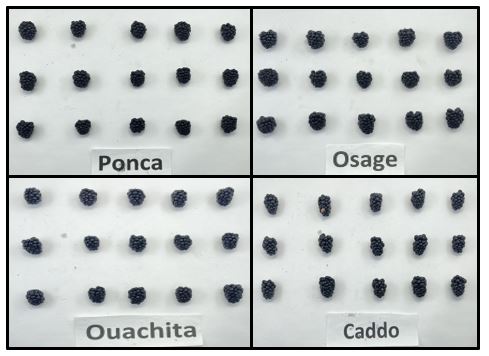
(‘Ponca’ , ‘Osage’, ‘Ouachita’, and ‘Caddo’ )
In this article:
Red Drupelet Reversion (RDR): A Key Factor in Postharvest Quality
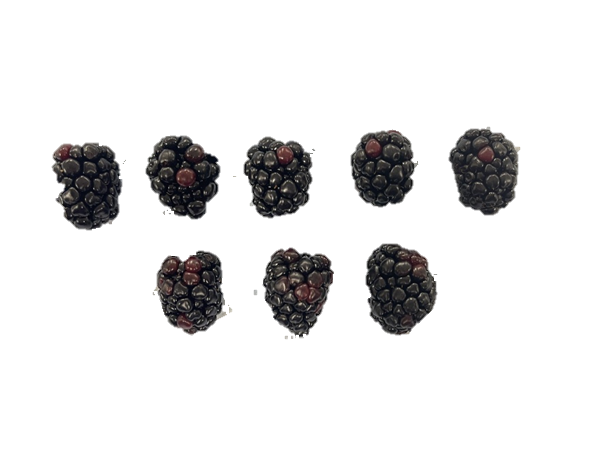
One of the most significant postharvest challenges for blackberries is red drupelet reversion (RDR), a disorder where black drupelets initially revert to a red color during or after cold storage (Fig 2). RDR is a physiological disorder that diminishes the appearance of blackberries in the fresh market, potentially leading consumers to perceive the fruit as unripe and of lower quality.
Among the cultivars, ‘Ouachita’ displayed the highest levels of RDR, persisting throughout the storage period. ‘Ponca’ also exhibited high levels of RDR, particularly after 21 days of storage (Fig 3). ‘Caddo’ and ‘Osage’ showed minimal RDR incidence.
The RDR incidence varied across the three harvests. In the second harvest, a significant rainfall event (29 mm = 1.1 in) occurred the day before and the morning of the harvest, which may have contributed to higher RDR levels (Tables 1-3).
.Figure 2. Severity of Red Drupelet Reversion (RDR) in blackberry drupelets.
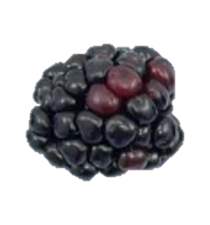
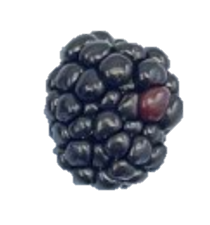
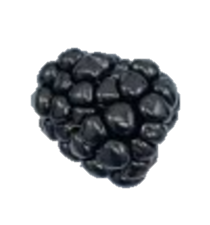
Fig. 3 Visual appearance of blackberries at harvest and after storage.
Red drupelet reversion
Table 1. Average number of berries exhibiting Red Drupelet Reversion (RDR) during the first harvest, categorized by a severity scale: No RDR, Low RDR and High RDR (based on the number of reverted drupelets).
RDR Presence First Harvest 2023
| Cultivar | Day 0 No RDR | Day 0 Low | Day 0 High | Day 21 No RDR | Day 21 Low | Day 21 High |
|---|---|---|---|---|---|---|
| Caddo | 39 a | 15 a | 6 bc | 27 a | 28 a | 5 b |
| Osage | 41 a | 16 a | 3 c | 24 ab | 26 a | 10 b |
| Ponca | 26 a | 12 b | 22 b | 34 ab | 10 b | 16 a |
| Ouachita | 8 b | 18 a | 34 a | 13 b | 27 a | 20 a |
| P-value | <.0001 | 0.0070 | <.0001 | 0.0290 | 0.0003 | <.0001 |
Table 2. Average number of berries exhibiting Red Drupelet Reversion (RDR) during the second harvest, categorized by a severity scale: No RDR, Low RDR and High RDR (based on the number of reverted drupelets).
RDR Presence Second Harvest 2023
| Cultivar | Day 0 No RDR | Day 0 Low | Day 0 High | Day 21 No RDR | Day 21 Low | Day 21 High |
|---|---|---|---|---|---|---|
| Caddo | 37 a | 16 ab | 7 c | 15 b | 29 | 16 a |
| Osage | 29 a | 19 a | 12 bc | 19 b | 30 | 11 ab |
| Ponca | 26 a | 10 b | 24 b | 17 b | 25 | 18 a |
| Ouachita | 5 b | 13 ab | 42 a | 36 a | 23 | 1 b |
| P-value | <.0001 | 0.0289 | <.0001 | 0.0013 | 0.2019 | 0.0002 |
Table 3. Average number of berries exhibiting Red Drupelet Reversion (RDR) during the third harvest, categorized by a severity scale: No RDR, Low RDR and High RDR (based on the number of reverted drupelets).
RDR Presence Third Harvest 2023
| Cultivar | Day 0 No RDR | Day 0 Low | Day 0 High | Day 21 No RDR | Day 21 Low | Day 21 High |
|---|---|---|---|---|---|---|
| Caddo | 39 a | 15 ab | 6 b | 26 | 31 | 3 |
| Osage | 41 a | 16 a | 3 b | 35 | 21 | 4 |
| Ponca | 26 a | 12 b | 22 a | 29 | 22 | 9 |
| Ouachita | 11 b | 15 ab | 34 a | 31 | 24 | 5 |
| P-value | <.0001 | 0.0275 | <.0001 | 0.2430 | 0.2454 | 0.1145 |
Firmness, Total Soluble Solids (TSS), and Titratable Acidity (TA)
Among the four cultivars, ‘Caddo’ exhibited the most consistent firmness across all storage periods. ‘Ponca’ had the lowest firmness at harvest and after 21 days of storage. ‘Caddo’ and ‘Osage’ maintained firmness better than the other cultivars.
Total Soluble Solids (TSS) represents the sugar content, while Titratable Acidity (TA) measures the acidity as a percentage of citric acid. Consumers typically prefer blackberries with a balanced sweetness-to-acid ratio.
Total Soluble Solids remained stable across all storage periods. ‘Caddo’ exhibited the highest TSS levels at harvest, which could contribute to its sweet taste and strong consumer preference.
Titratable acidity, however, has variable results. ‘Caddo’ exhibited a significant increase in acidity after 7 days of storage. In the third harvest, ‘Ouachita’ experienced an unusual spike in acidity 7 days after storage. ‘Osage’ also exhibited an increase in acidity during storage.
(Data not shown)
Sensory Analysis: What Do Consumers Prefer?
The sensory evaluation was conducted using a non-trained panel. Twenty participants rated each cultivar using a 9-point hedonic scale (1 = dislike extremely, 9 = like extremely). The parameters assessed included overall flavor, appearance, color, size, firmness, sweetness, and sourness.
Significant differences in three to four attributes were found following two of three harvests (Tables 4-6).
At the first harvest, ‘Caddo’ was rated significantly higher than ‘Ouachita’ for overall flavor, overall appearance, size, and sweetness. ‘Osage’ was not significantly different from ‘Caddo’ in these attributes, and its flavor, size, and sweetness were also rated significantly higher than those of ‘Ouachita.’ ‘Ponca’ was rated in the middle and, while rated significantly higher than ‘Ouachita’ for overall flavor and significantly lower than ‘Caddo’ for size, its ratings were usually not significantly different from those of other cultivars.
At the third harvest, ‘Osage’ was rated significantly higher than ‘Ouachita’ in overall flavor, size, and sweetness. ‘Caddo’ and ‘Ponca’ ranked significantly lower than ‘Osage’ for size, while their ratings for flavor and sweetness were not significantly different from those of either ‘Osage’ or ‘Ouachita’.
Table 4. Sensory attributes of the four blackberry varieties were evaluated during the first harvest using a 9-point hedonic scale. 1 = dislike extremely, 9 = like extremely, 5 = neither like nor dislike.
Taste Panel – First Harvest
| Cultivar | Overall Flavor | Overall Appearance | Color | Size | Firmness | Sweetness | Sourness |
|---|---|---|---|---|---|---|---|
| Caddo | 7.00 a | 8.40 a | 8.36 | 8.56 a | 8.04 | 6.84 a | 5.64 |
| Osage | 6.72 a | 7.60 ab | 7.96 | 7.68 ab | 7.24 | 6.28 a | 5.20 |
| Ponca | 6.68 a | 6.92 b | 7.92 | 6.72 bc | 7.2 | 6.12 ab | 4.68 |
| Ouachita | 5.08 b | 7.20 b | 7.48 | 6.64 c | 7.08 | 4.84 b | 5.64 |
| P-value | 0.0006 | 0.0004 | 0.0959 | <0.0001 | 0.1223 | 0.002 | 0.2947 |
Table 5. Sensory attributes of the four blackberry varieties were evaluated during the second harvest using a 9-point hedonic scale. 1 = dislike extremely, 9 = like extremely, 5 = neither like nor dislike.
Taste Panel – Second Harvest
| Cultivar | Overall Flavor | Overall Appearance | Color | Size | Firmness | Sweetness | Sourness |
|---|---|---|---|---|---|---|---|
| Caddo | 6.91 | 8.18 | 8.32 | 7.95 | 7.59 | 6.82 | 5.36 |
| Osage | 6.23 | 7.05 | 7.59 | 6.64 | 7.05 | 6.45 | 5.5 |
| Ponca | 6.91 | 7.64 | 7.95 | 7.45 | 7.41 | 6.73 | 5.23 |
| Ouachita | 6.45 | 7.82 | 8.41 | 7.55 | 7.45 | 5.77 | 5.05 |
| P-value | 0.6157 | 0.1268 | 0.2254 | 0.0793 | 0.6471 | 0.3283 | 0.9385 |
Table 6. Sensory attributes of the four blackberry varieties evaluated during the third harvest using a 9-point hedonic scale. 1 = dislike extremely, 9 = like extremely, 5 = neither like nor dislike.
Taste Panel – Third Harvest
| Cultivar | Overall Flavor | Overall Appearance | Color | Size | Firmness | Sweetness | Sourness |
|---|---|---|---|---|---|---|---|
| Caddo | 6.72 ab | 7.28 | 7.66 | 7.00 b | 6.93 | 6.28 ab | 5.62 |
| Osage | 7.24 a | 7.97 | 8.14 | 8.24 a | 7.66 | 6.79 a | 6.17 |
| Ponca | 6.17 ab | 7.57 | 7.86 | 7.00 b | 6.86 | 5.86 ab | 5.70 |
| Ouachita | 5.66 b | 6.93 | 7.76 | 6.93 b | 6.97 | 5.17 b | 5.31 |
| P-value | 0.0072 | 0.0639 | 0.6154 | 0.0104 | 0.2370 | 0.0358 | 0.5141 |
Conclusions
‘Ouachita’ was the least favored cultivar. ‘Osage,’ ‘Caddo,’ and ‘Ponca’ had numerically higher ratings for sweetness, size, and overall flavor following the first and third harvests, though differences were not consistently significant for all cultivars. No significant differences were obtained in the second taste panel due to the rain. In addition, ‘Ouachita’ had higher RDR at harvest, but RDR decreased after storage, maybe due to anthocyanin degradation.